
In this article, we'll discuss two of the most popular tools for data analytics, Excel and Python. We'll walk through how each of these tools fares across a variety of dimensions to help you with your next steps in professional development and learning.
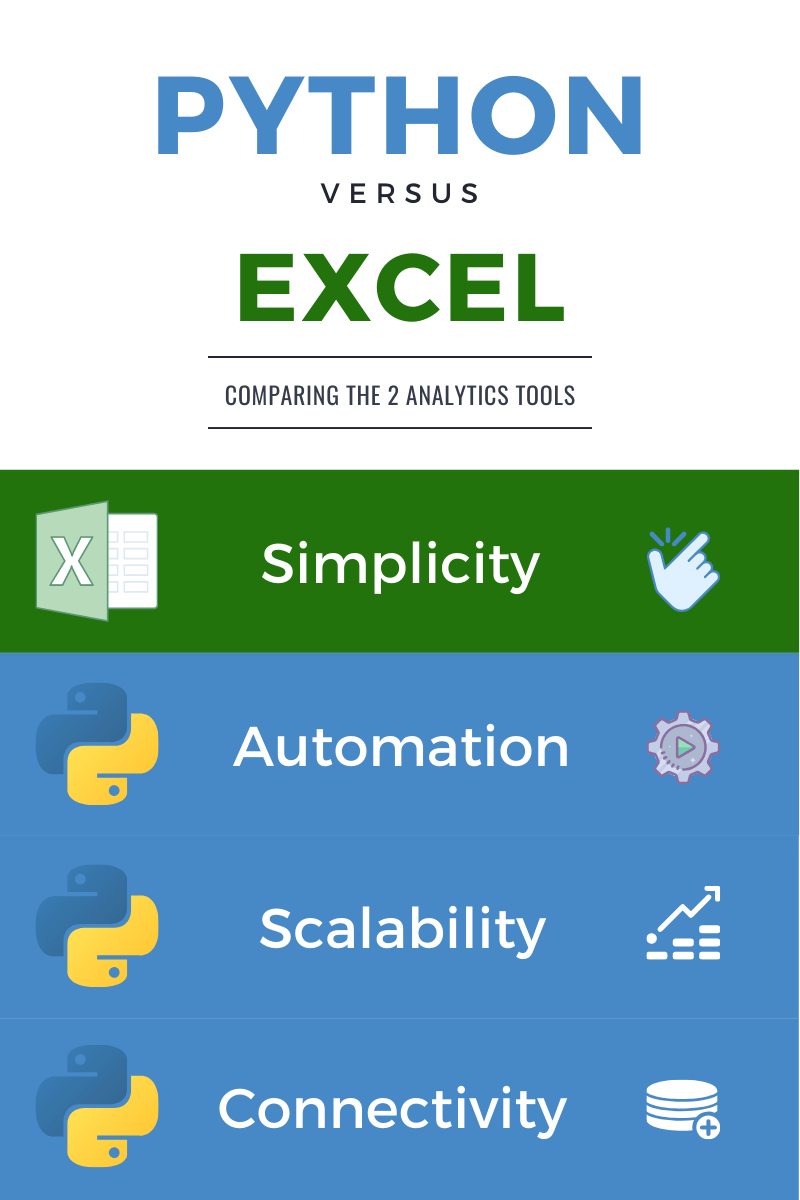
Python Vs. Excel for Data Analytics
Excel spreadsheets are the standard in the business world for all kinds of data analysis tasks. While Excel’s simplicity makes it so commonplace, it also brings about some limitations. Python, on the other hand, is a programming language that is commonly used for data analysis and data science. We’ll go head-to-head on Python vs. Excel across a couple of important dimensions.
1. Ease of Use
Excel is the most widely used data management and analysis tool and its ease of use is likely a large contributor to that. Most people in the business world have some baseline level of comfort using Excel as they are often using Excel files for various tasks. Excel can be used for simple things like managing contact lists, creating schedules or timelines, and basic calculations. All of these tasks require minimal knowledge of Excel and can be picked up fairly quickly. It is not uncommon for users to go from zero Excel knowledge to intermediate or advanced level knowledge within just days (as you can with our 3-day Excel Bootcamp)

You can download Excel in minutes and start writing your first formulas with a quick tutorial. With just a couple minutes of an intro, you can start doing a handful of things like adding numbers, finding averages, and even making charts. Excel is the perfect tool for someone who dabbles with data or just wants to keep track of schedule but doesn't necessarily want to go too deep into data analytics.
Python, on the other hand, has a fairly steep learning curve if you have little or no programming experience. One of the most daunting tasks for non-programmers is setting up the right environment for using Python. You’ll have to use your Command Prompt or Terminal window to download Python and statistical libraries using pip installs.
It also takes a while to get familiar with manipulating and wrangling your data via coding data rather than clicking it on Excel’s graphical user interface (GUI). Python’s steeper learning curve makes it a little bit less mainstream as a data analysis tool for the casual user. That being said, more and more companies are moving to cloud-based data infrastructures like Amazon Web Services and Google Cloud Platform to store their data. The trend in big data and cloud storage is making employees skill up to have some knowledge in programming and querying skills to work in data-driven companies.
Fortunately, there are a handful of free resources and relatively cheap training programs out there. This is lowering the barrier to entry in learning Python and there has never been an easier time to learn how to use Python as long as you have the determination to learn.
Since Excel is a GUI, you can pretty much just open a sheet and play around with your mouse. Python doesn't really have that user-friendly interface which makes it a bit more daunting to use at first. However, more tools and online courses are breaking down those boundaries. For example, www.learnpython.org takes out all the setup challenges with Python and allows you to start writing simple queries early on and see the outputs right there.
All in all, Excel is much easier to get started in and is much more user-friendly, despite the handful of free tools out there meant to make Python easy to learn.
Winner: Excel
2. Scalability & Big Data
When it comes to scaling and working with larger and multiple datasets, Python has some serious advantages that can’t be overlooked. Excel can only handle so much data and the more data and tabs you have in your workbook, the more difficult it becomes to manage and the slower the file will be.
This often leads the program to crash and lose any unsaved work. Excel is not really meant to act as a full data warehouse with many tables and millions of entries. This gets even slower and more crash-prone when you’re sharing the file on the cloud with your teammates through SharePoint. When you’re using Python, you can save your data as its own separate file and write your code as another file that interacts with the data. This provides many advantages in computational speeds and stability as you potentially wrangle millions of rows of data.
As you scale up in the data you are using, creating a database, and interacting with querying languages like MySQL or PostgreSQL will become more beneficial. Fortunately, you can write SQL queries seamlessly and code in Python in the same notebook to wrangle the extracted data. Notebooks like Jupyter Notebook are equipped to handle lots of data really quickly and it is the preferred solution when working with big data due to its containerized nature.
Let's say you are working with millions of rows of data or a variety of tables. In Excel, it would be a nightmare to go up and down all those rows or create formulas across multiple sheets. Furthermore, you are not able to see the work you’ve done in your analyses so if you make a mistake, you cannot return to your error to fix it. Working in containerized environments like Jupyter Notebook will help you fix errors easily and show your work as your math teacher asked you to in fifth grade.
In Python, the number of rows or columns of data doesn't really change anything because you are not interacting with the data in an interface. However, you can still access and visually check sections of your dataframe in case there are outliers or particular points of interest you want to check without loading the entire dataframe like Excel. In the case of working across multiple sheets or tables, Python also makes this a lot easier because you can easily merge/join data from different tables on specific fields.
Excel is powerful, but Python will upgrade your data science and analytics workflow because you can integrate data extraction, wrangling, and analytics in one environment. Most importantly, you can show all your work in containers that will make it easier to fix mistakes than Excel. Working in a programming language basically becomes a necessity when you’re dealing with big data or lots of datasets.
Winner: Python
3. Automation Capabilities
One of the big buzzwords these days is “automation, ” and rightfully so. Automation can be extremely helpful to clear up repetitive tasks that take up lots of valuable time. More and more businesses are largely data-driven which means reporting and analysis are the core of lots of roles. These reports and analyses can span lots of tables and data and can require a lot of time.
Thankfully, using Python can help automate a lot of your work so it can easily be replicated or automated. Say we need to make a monthly report with various breakdowns of our sales performance, this could easily mean 10 different charts. If we wanted to remake this in Excel each month, we’d have to pull in our data, make 10 pivot tables or charts, and then copy them over to a PowerPoint presentation. The key point is we would have to do that process every month and it introduces many points where human errors could be made.
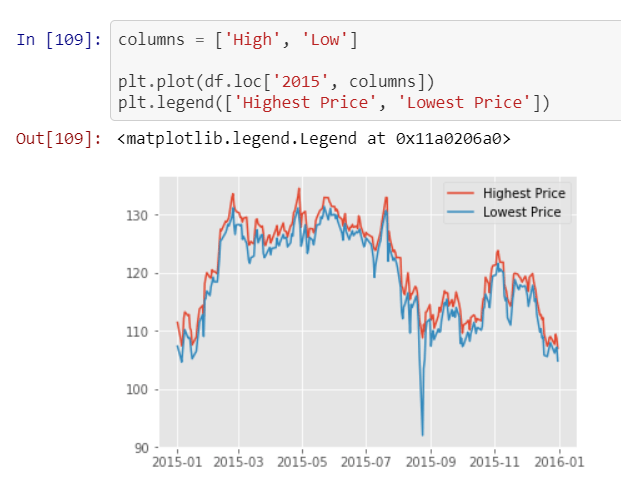
With Python, you can connect directly to our database in Jupyter Notebook and write 10 or so queries or chunks of code that would aggregate and manipulate our data to create any views we want. You can also use data visualization libraries like Matplotlib and Seaborn to create visualizations seamlessly integrated into Jupyter Notebook. You can also code your program to grab data from your database on a scheduled time to get the most up-to-date analysis.
Once we create this notebook, we can simply hit “Run” and the entire notebook of data and charts will be created or updated for us automatically. This literally saves hours of work, improves productivity tremendously, and enables business stakeholders to make data-driven decisions more effectively.
All of the steps we would have needed to go through in Excel each month could be automated with Python.
Instead of making those Excel reports from scratch each month, you or your teammates can automate your job with Python and just hit run each month. Finally, the Python script you’ve written in your notebook could be shared on GitHub so your teammates can easily track changes to the code and modify it even if you leave the company or on vacation. Knowledge continuity and transfer become much easier.
Winner: Python
4. Data Connectivity
Lastly, our analytic tools can only be useful if we can access the data we need to analyze. Depending on the type of work you do, one tool might be better than another. If you work with cloud-based data, then connecting that data with Python through a containerized notebook like Jupyter Notebook is a big advantage. As alluded to in the automation section, you can write blocks of code to connect and analyze data in the cloud and use the same scripts to repeat those processes instantly and at a scheduled time of your choosing.
Connecting to cloud-based data is also possible with Excel, but it is a bit more difficult and Excel is not really meant to stream large amounts of data. Excel has made strides in this category which makes it a lot better of a tool, but when compared to Python it doesn't have the same level of connectivity nor integration capabilities. Excel was created long before big data and cloud data platforms were invented. It was originally designed as a financial reporting tool and it cannot handle the amount of data modern companies are using to make business decisions.
On the flip side, if we are working with basic reports, say exports from an email client or Shopify site, then Excel will probably be the easier option since that is usually the default format for these exports. That being said, Excel files can also be imported into a Python notebook from your local machine if you’d prefer to use Python for all your analyses.
Finally, Python has great open-source libraries like Pandas that can read and merge datasets from diverse sources like Excel, CSV, and JSON into one format. This alone is incredibly helpful for data extraction and wrangling which will transform your raw data into something way more valuable and proprietary.
Winner: Python
Key Takeaways
While Excel’s main advantage is its simplicity and easy ramp-up, Python is a high-powered solution for data science and analytics. It is a versatile and powerful tool for analysts working in data-driven companies and hobbyists looking to improve their analytical skills because it can handle massive amounts of data easily, automate reporting, and connect to databases from the notebook seamlessly. Furthermore, Python has been consistently ranked as the most popular language since 2016 because of the plethora of open-source statistical libraries it has and the active community members contributing to make Python even better.
To summarize, you can understand and compare Excel and Python in these ways:
- Excel is best when doing small and one-time analyses or creating basic visualizations quickly. It is easy to become an intermediate user relatively without too much experience due to its GUI.
- Python is harder to learn because you have to download many packages and set the correct development environment on your computer. However, it provides a big leg up when working with big data and creating repeatable, automatable analyses, and in-depth visualizations.
If the power of Python for analytics and data science excites you and you want to learn more, see our Python courses and certificates. If you feel like starting with Excel is the right next step for you then see our Excel classes offered by our affiliate school, NYIM Training.