
Learn to wrangle data with Python in this tutorial guide. We'll walk you through step-by-step to wrangle a Jeopardy dataset.
Data wrangling (otherwise known as data munging or preprocessing) is a key component of any data science project. Wrangling is a process where one transforms “raw” data for making it more suitable for analysis and it will improve the quality of your data. In this tutorial, we will use Jeopardy questions from the Jeopardy Archive to wrangle textual data and process them for classification. Although one might not use all of the methods listed here depending on the data, there are several preprocessing methods that encapsulate the entire process:
- Data Exploration: Checking for feature data types, unique values, and describing data.
- Null Values: Counting null values and deciding what to do with them.
- Reshaping and Feature Engineering: This step transforms raw data into a more useful format. Examples of feature engineering include one-hot encoding, aggregation, joins, and grouping.
- Text Processing: BeautifulSoup and Regex (among other tools) are often used to clean and extract web scraped texts from HTML and XML documents.
Importing Libraries
Let’s start by importing several libraries we’ll need for exploring our data and cleaning textual data
- Pandas: We will need Pandas to navigate our dataframe and check for each column’s data type, null values, and unique values.
- NumPy: This package is essential for any data science project. It has a lot of mathematical functions that operate on multi-dimensional arrays and data frames.
- Matplotlib & Seaborn: They are plotting and graphing libraries that we will use to visualize data in an intuitive way.
Loading the Data
Let’s load our data, run df.head() on it, and see if we can load up a question.

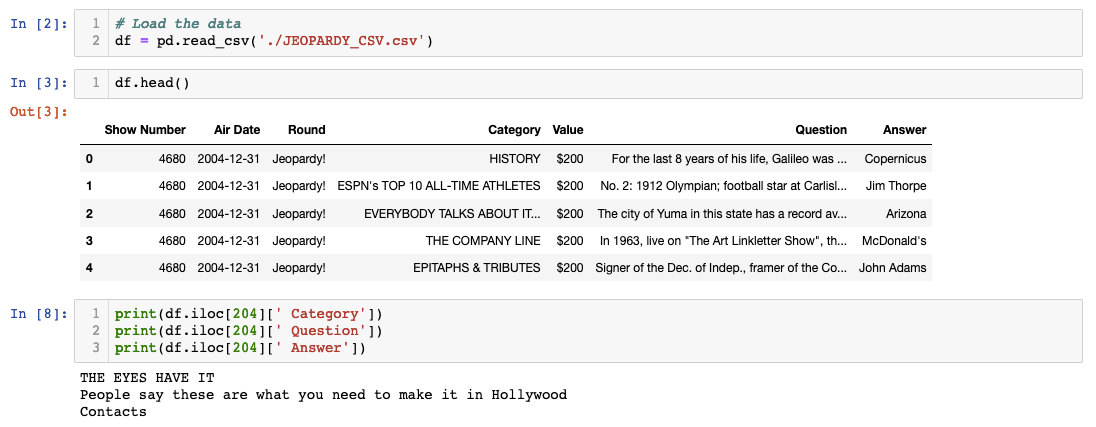
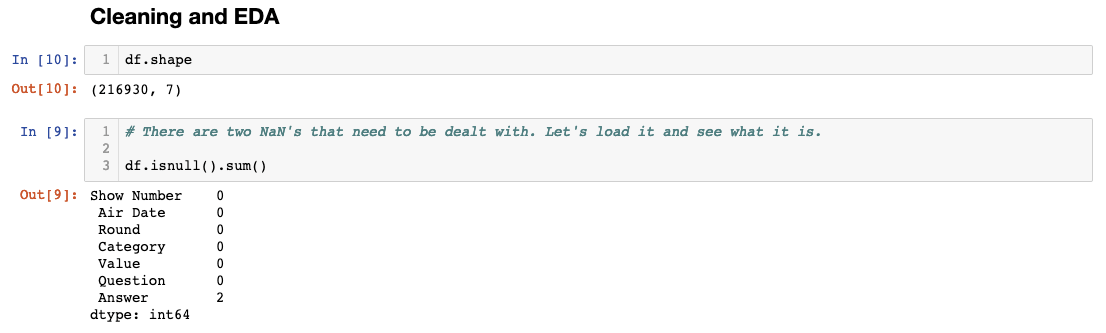
Fortunately, the data looks pretty clean so far! One thing I’ve noticed right away that might cause a little inconvenience is how there’s an extra space in the column names. I will have to return to that issue and fix it. We’ll learn how to rename column variables soon. But first, let’s check the shape of our dataframe and check for null values.
Exploratory Data Analysis
It looks like the Answer column has two missing values. I’ll load the two rows with the missing answers to see how I will deal with them.
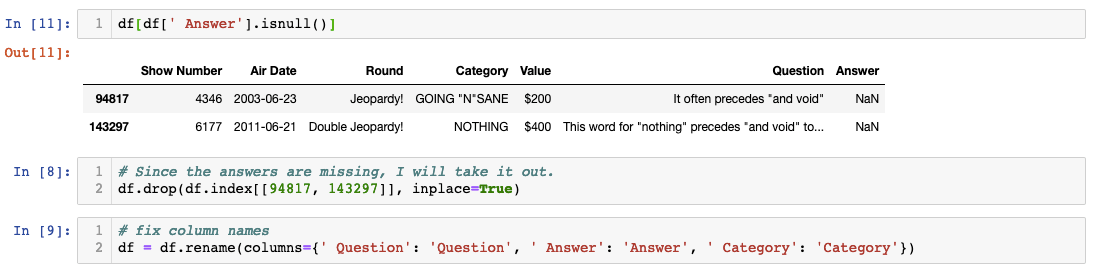
I’ve used a technique called “masking” to highlight the two missing rows that have null values. Once I can see the index number associated with the rows, I can decide what to do with them. In this case, since there are only two null values, I’ve decided to drop them (especially since they are text data and I don’t know the answer to the questions)! Lastly, I’ve fixed the column names.
Now that the null values are taken care of, let’s do some EDA to see what the top 10 most popular answers to Jeopardy questions are:
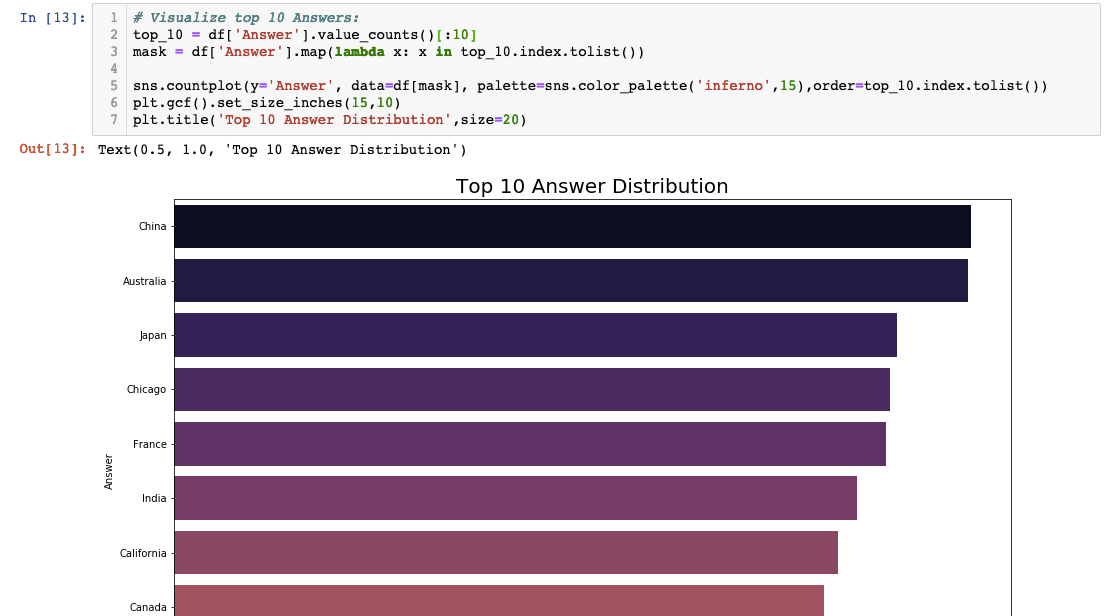
I’ve used a method called value_counts() to count the number of answers that are the same and stored in a variable called top_10. The ‘[:10]’ tacked on the end grabs the first 10 rows. I’ve created a mask that I will use to plug in Seaborn to create a horizontal bar chart to visualize the top 10 most common answers in Jeopardy.
For thoroughness' sake, let’s repeat the same process to see what the top 10 most popular questions are. I assume Alex wouldn’t reuse questions so I’m expecting everything to be one.
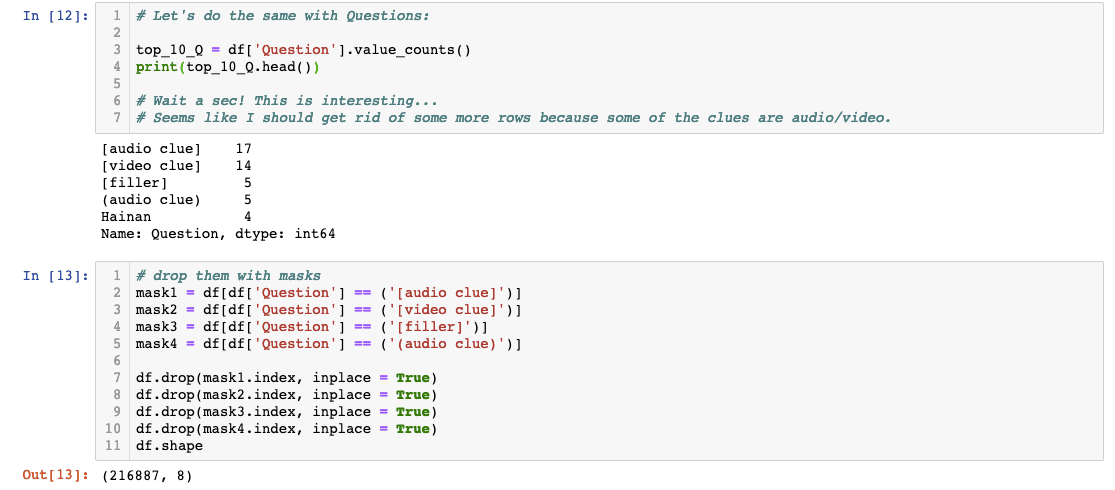
Aha! I’m glad I checked the questions and challenged my assumptions because there are quite a lot of audio and video clues! Since I will ultimately be using this data for classification and clustering, I should delete them from the dataset. I’ve gone ahead and listed them one by one instead of creating a loop for clarification's sake. This would’ve created some problems for our model if we weren’t paying attention!
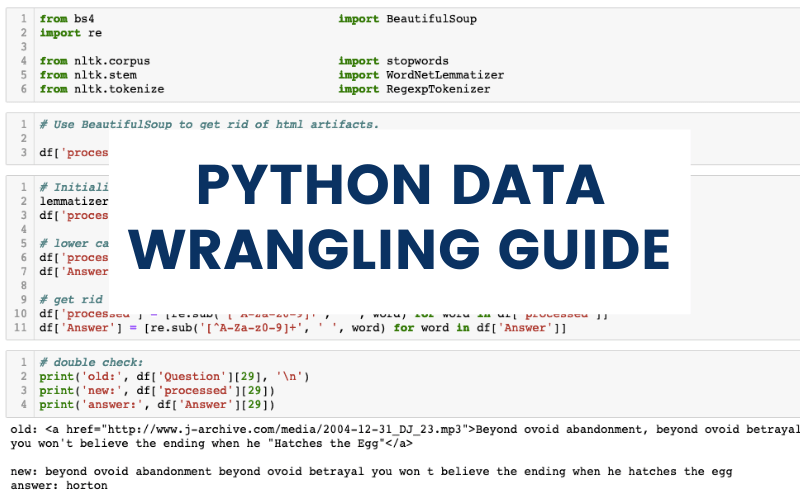
Text Preprocessing
While I was looking around the dataset, I realized some of the values had URLs and HTML tags embedded within texts. We will need to clean that up before we can analyze the data. We need to import a library called BeautifulSoup (BS4) to accomplish this. BS4 extracts text data from HTML and XML documents and it is a widely used package when dealing with scraped data.
Besides getting rid of HTML artifacts, we will need to get rid of punctuation marks in our texts, lowercase everything, and lemmatize words. For getting rid of punctuations, I’ll use regular expression (or regex as the cool kids call it) and for lower-casing everything, I’ll use Python’s built-in method.
Before we start munging our text data, I would like to highlight an important best practice. Instead of munging our original data, it is better to copy the data we’ll be using and create a new column from it. In this case, I’ve created a feature called “processed”.
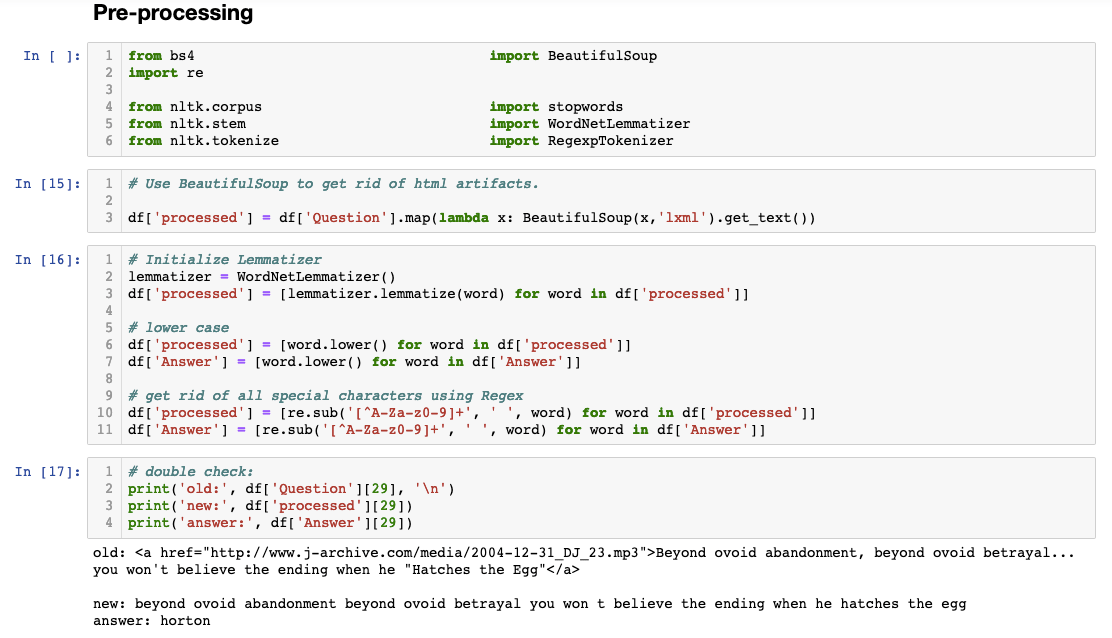
I’ve printed out the original and processed versions for your convenience.
Recap
EDA is an important process even when you’re working with textual data and it helped us catch some interesting quirks we otherwise would’ve missed. I hope this exercise made you appreciate the importance of wrangling data!


