
Discover the power of Tableau's table calculations, a tool that allows you to transform and analyze data within your views without affecting your actual data, and learn how to execute, save, edit, and remove these calculations.
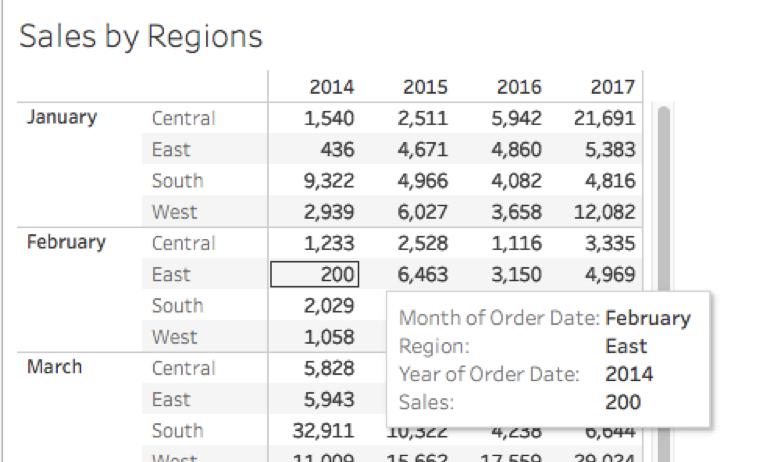
Figure 1.
What Are Table Calculations?
Table calculations are calculations performed locally by Tableau. They use only the data that makes up the view, sometimes referred to as the fieldset. These calculations don’t affect your actual data as they are computed on the underlying data table of the view. You can use them to transform values in the view, for instance, to create data rankings, to show running totals, or percentages of the total.
How is the Table Calculation Performed?
When executing a table calculation, Tableau considers the underlying “table” that represents the dimensions on the view as the basis for any of the calculations. Tableau also takes into consideration the level of Detail (in the mark cards) you have applied to the view (as highlighted in red in figure 2).

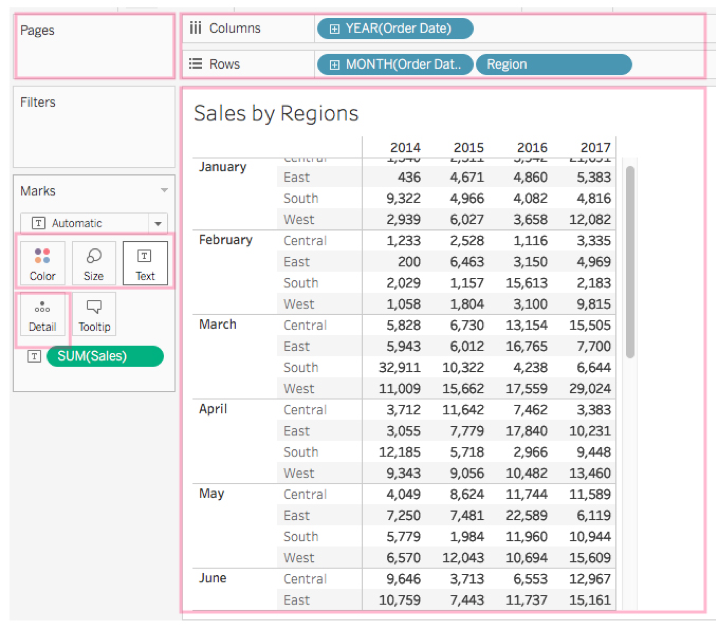
Figure 2.
Within the Table calculation panel, Tableau allows you to select the type of calculation and the method to compute within the “Table.” For example, selecting Table (across)computes across the length of the table and restarts after every partition, as highlighted in yellow in figure 3.
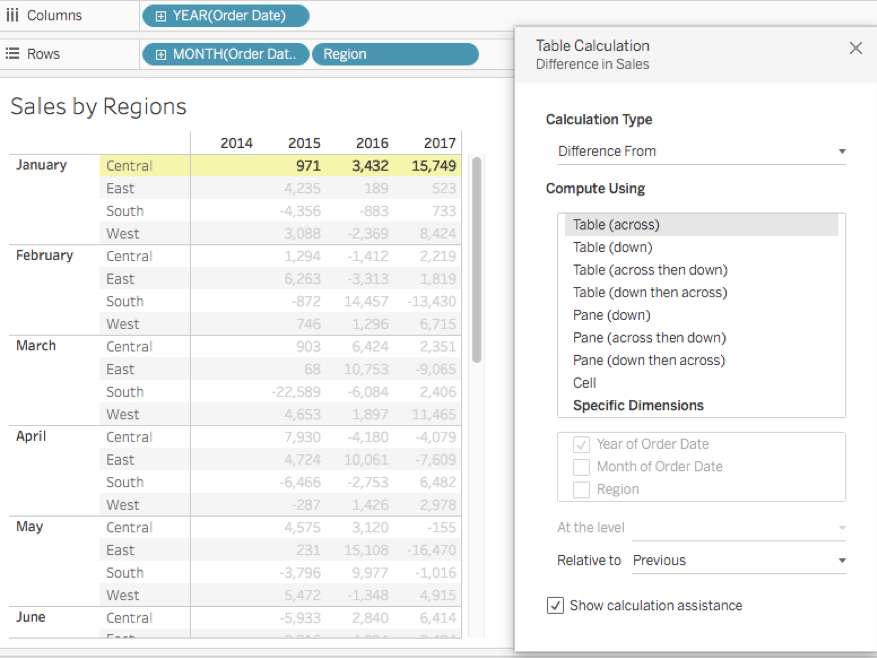
Figure 3.
Other ways to compute include Table(down), Table (across then down), Table (down then across). You can apply the same to the pane such as Pane (down), Pane(across then down), Pane(down then across) and can compute as well with a cell or within a specific dimension.
When you select by “Specific dimension, ” additional options are highlighted to compute with a selected field, and a “Level” if you select more than one dimension. Note, the dimension not selected, here “region, ” establish the order of partition (figure 4). Other option settings include “Relative to” and “Sort order.”
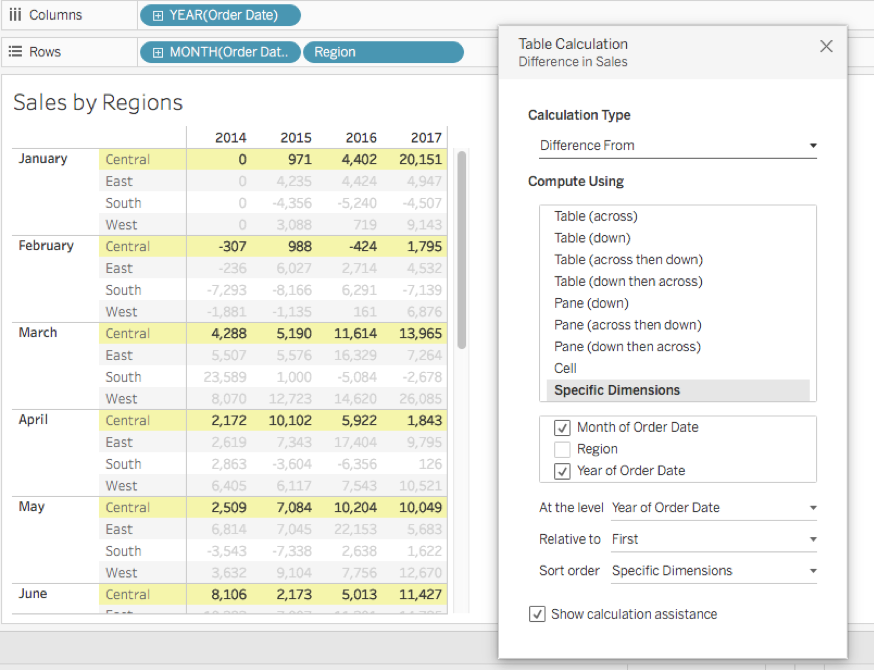
Figure 4.
The Different Types of Table Calculations
Quick Table Calculation
Quick Table Calculations are pre-computed calculations available from the menu of your field in the view, and are applied directly to the view. For a particular field, right-click on the pill in the shelves or the mark card and select Quick Table Calculation.
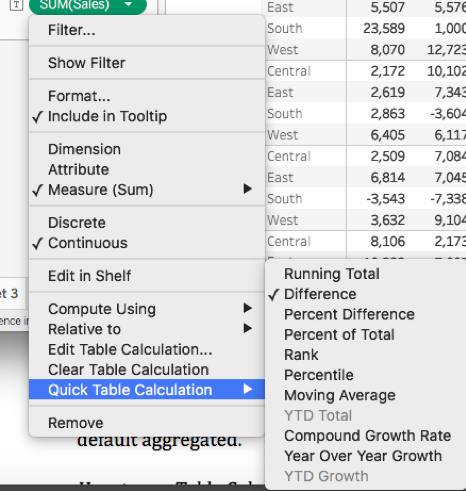
Figure 5.
You have the option to save the quick table calculation for later use. After applying your calculation, drag the pill to the data pane and it will be stored as a calculated field.
Note: Quick table calculations are also created on the returned results of the view, which means they are dependent on the view data, not the full data table.
Using the Calculation Editor
Table Calculations can be written with the editor too.
Go to the Analysis menu tab and select “Create calculated field” (figure 6.)
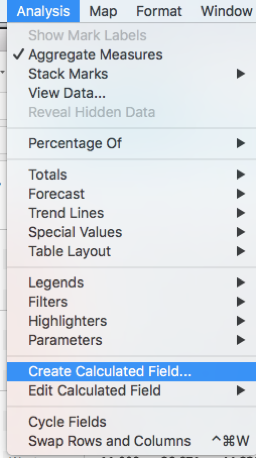
Figure 6.
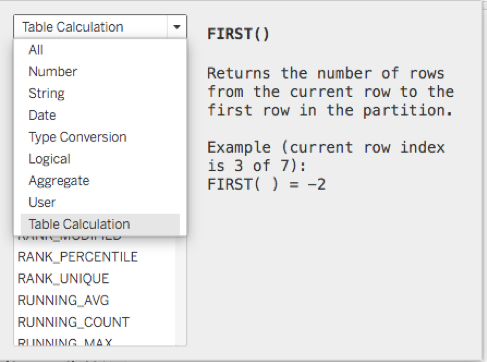
With the calculation panel open, select Table Calculation to display a list of all possible Table Calculations.
Any dimension you use in your table calculation will need aggregation (SUM) when manually written using the editor as your data is by default aggregated.
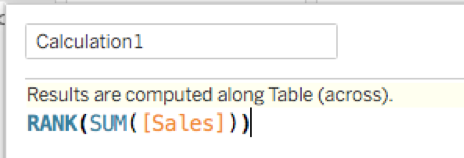
Figure 7.
Using Table Calculation Options
First, connect to your data source, and create a new worksheet drag your desired field to the shelves and on the Marks card, right-click your field, and select Add Table Calculation to open the Table Calculation panel.
Within the Table Calculation dialog box that opens, as shown in Figures 3 and 4, select Calculation Type to select “Difference From” or another calculation of your choice. For Compute Using, select Table (across) or other options. As you make these selections, the table view updates with yellow indicators to guide you, showing you the table values being calculated. When finished, click the “X” at the top to exit the Table Calculation panel. Your calculation is automatically applied to the values within the current visualization.
To edit your Table Calculation, click again on the menu for your field and select “Edit Table Calculation.”
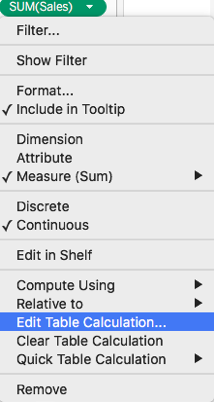
Figure 8.
You can remove your Table Calculation with the same menu by selecting “Clear Table Calculation.”
Conclusion
Table Calculations is Tableau's powerful tool to customize quick table views.
Your data can then be analyzed for various purposes such as ranking or to compare numbers over time without leaving your current visualization. As we’ve demonstrated, you can reuse these calculations. The Quick Calculation feature is also a good starting place to get familiarized with Table Calculations.
Resources