
Explore the ways in which Tableau, a leading data visualization tool, offers remarkable speed, powerful integration, and impressive scalability, and discover how you can get started with this comprehensive software.
Data Visualizations are an undeniable part of how we communicate information about our data. Nowadays, most teams use data visualization tools to get insight into their raw data, and it can be difficult to decide what tool to use within your organization. Having worked in the field of Data Visualization for the past eight years, I found myself more and more inclined to recommend Tableau to my clients looking for better ways to leverage their data.
It is fair to say that Tableau is an extremely powerful tool, and has no equal in data visualization capabilities and performances. Not only for its speed, scalability, but also for offering the best tools to create visual answers to most of your business questions, from bar charts to more complex visualization, including rich maps with tons of customizations. And best of all, Tableau is free to use for the Tableau Public version!
How Does Tableau Compare to Other Tools?
There are many reasons why a vast majority of businesses have adopted Tableau:

Speed
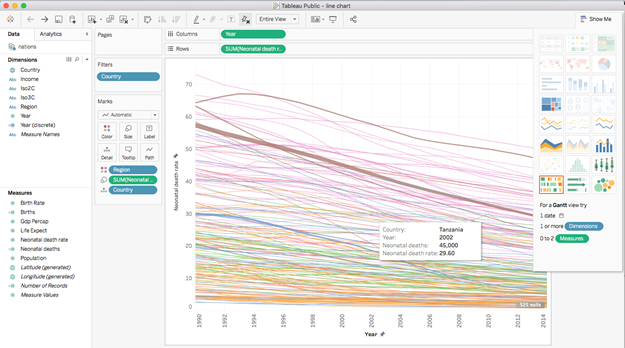
It takes much less time to create graphs in Tableau compared to software like Microsoft Excel. Besides, unlike Excel, Tableau uses algorithms to format your graph intelligently, leveraging most of the heavy lifting in data analysis.
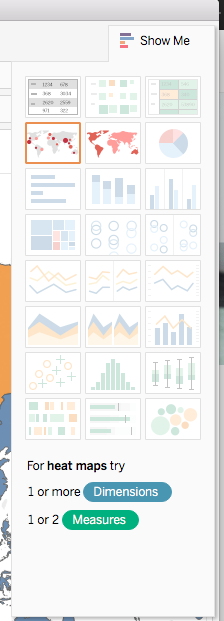
Tips: Select your data fields in Tableau, and use the Show Me Panel feature to quickly browse through possible graphs to represent your data.
Powerful Integration
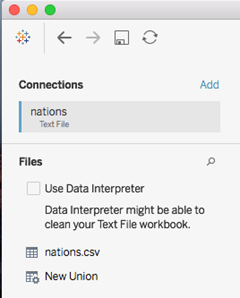
Tableau allows you to work with your raw data in many formats: Excel files, text files, and even tables from pdf documents from which Tableau can extract the data. Tableau can also connect to your organization's database.
Tip: Cleaning up the data using the data interpreter with a simple click.
Tableau has a functionality named the Data Interpreter. Use it to clean your imported Tables and remove any unnecessary information that is not part of your dataset.
Scalability
While Excel cannot handle a large amount of data, Tableau is robust and doesn’t break when importing big data.
Tableau works like an all-in-one tool; you do not need to jump to another tool to create your presentations for your data. In Tableau, it is all integrated.
Tableau goes further by allowing you to create Dashboards. One of the most important parts of how Tableau works with the dashboard is that your data is interactive. You can control your dashboard, and your dashboard automatically updates to show you the data you have queried.
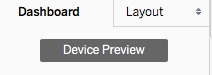
Tip: Click on the Device Preview button in your Tableau dashboard to customize it to various device sizes (desktop, tablet, or phone), with many layout sizes to choose from.
Getting Started with Tableau
It might take you time to get up and running with Tableau, and you might consider taking a course to get you started. The software is a beast, packed with many tools and menus, and it can be difficult at the beginning to keep a steady workflow on a project you are creating with Tableau. We recommend having experience with spreadsheets, as it will help you with data analysis.
Thanks to its WYSIWYG (What-You-See-Is-What-You-Get) interface, Tableau is the perfect environment to quickly connect to your dataset and interact with the data to create stunning visualizations on the fly.
It might be daunting to learn new software; however, Tableau is suitable for novice and experienced analysts as it is the most scalable solution for all your data, from a simple spreadsheet to big data. If you are unsure where to start, we offer courses that cover the main tools to help you tackle your data visualization needs.
Conclusion
Although other programs like Excel have started incorporating more visualization tools in their program, Tableau remains the leader in Data Visualization tools, and the ever-growing access we have to more data should convince you to shift to Tableau to improve your productivity and get more insight into your data.
There are many different versions of Tableau to fit your organization’s need. You can use Tableau Public the free version of the software as long as you first publish your visualization to the Tableau online platform. Check out the website to find out about Tableau offerings. Tableau also offers a Tableau Desktop and Tableau Server version for more extensive use.
Resources