Delve into the world of data analysis and understand the importance of modalities, skewness, and kurtosis in interpreting complex data distributions. These fundamentals are instrumental in modeling real-world events through machine learning and enabling data scientists to make accurate predictions.
Key Insights
- Modalities refer to the peaks in data distribution. Unimodal data has one peak, Bimodal data has two peaks, and Multimodal data has multiple peaks with the same maximum frequency value.
- Skewness describes three types of data distribution: positive, negative, and symmetrical. The first two refer to the direction of the long tail of the data, while symmetrical distribution has no skew.
- Skewness is crucial in data modeling as it allows analysts to make predictions off skewed data, which is the most common type of data in the world.
- Kurtosis measures the tails of data distribution and is used to determine the presence of outliers. It is often used alongside skewness to judge the probability of events.
- A high Kurtosis makes data scientists reconsider their model, while a low Kurtosis might indicate duplicate data in the model.
- While understanding Skewness and Kurtosis is essential, Python libraries simplify the process of performing these tasks in data analysis.
This article will discuss different ways to describe visual data, this topic is a bit different from the others as it is less technical math and more learning how to interpret the graphs that you built using the math we learned.
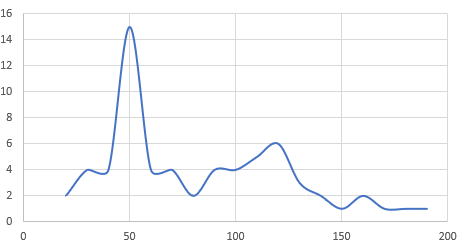
What good is it if you build these complex distribution charts but cannot fully extrapolate all the information from them, that sounds like inefficiency to me. Modality, Skewness, and especially Kurtosis might seem like daunting words, but they are very intuitive. For example, look at the graphs below – what do you notice? The first thing that most people will notice is that the graph “peaks” at 50 and does not really have a true peak at any other value, rather some small increases.

In mathematical terms, this graph would be considered Unimodal, meaning that the data has one peak. If at another point in this graph – there was a value with the same frequency level of 50 then this graph would be considered Bimodal. Furthermore, if the graph has multiple points that have the same maximum frequency value than it would be considered Multimodal. The basics of this topic are digestible and might seem rudimentary, but they are vital when a programmer is trying to model real-life events using machine learning.
Skewness
Now let’s go over Skewness, there are three types of Skewness: positive, negative, and symmetrical. A positive skew is when the long tail of the data is on the positive side of the peak. On the other hand, a negative skew has a long tail in the negative direction. Lastly, a symmetric distribution has no skew and can be seen in an older blog post, Standard Deviation & Variance in Python. Now that I gave you the definition of Skewness – is the graph above positive, negative, or symmetrically skewed?
You might ask why is Skewness important or what is it used for? The answer is that since almost all, if not all our data in the world is not perfect, thus it's not normally distributed. Therefore, to predict off skewed data, you must understand what the Skewness tells us and how to input that knowledge into the model.
Kurtosis
Furthermore, Skewness is used in conjunction with Kurtosis to best judge the probability of events. Kurtosis is very similar to Skewness, but it measures the data’s tails and compares it to the tails of normal distribution, so Kurtosis is truly the measure of outliers in the data. Therefore, a high Kurtosis in a regression would cause the data scientists to rethink their model, while a low sign of Kurtosis might give us confidence in the model, but be careful since too low of a Kurtosis on the initial model might mean we have duplicate data. There are formulas to find the level of Skewness and Kurtosis, but they are very complex and are not necessary knowledge until we go into the regression portion of the blog.
This section is less about Python and more about understanding data and how to analyze data. To perform these various tasks in Python there are libraries in which you can Google that have Kurtosis and Skewness attributes.


